25th CT users group meeting: 19/10/2023
The 25th CT Users Group meeting was held on the 19th of October 2023, at Cardiff City stadium. The programme is shown below, with links to pdf versions of some of the presentations.
Please note: information provided in the slides is not peer-reviewed, is for educational use only and is explicitly not to be used for sales or marketing purposes. Any of the authors can be contacted, via the CTUG if no contact information is provided in the slides, to discuss the contents.
| « Previous meeting | – | Meetings Index | – | Next meeting » |
|---|
MEETING PROGRAMME
Session 1 - Invited Talk
10:00 CT revolutions: the impact of CT imaging on the role of the medical physicist - Elly Castellano - Royal Marsden Hospital NHS Foundation Trust
Session 2 - Image Quality
10:30 What happens to image quality at the edge of the couch? - Gareth Iball[1], Charlotte Porter[2], Frankie Lenham[2] - [1] University of Bradford, [2] Leeds Teaching Hospitals NHS Trust
Traditional image quality phantoms typically have a diameter of approx. 20cm with the majority of the test details located within the central 15cm of the phantom. This is appropriate for assessment of head scan protocols as this phantom size matches well with the typical adult head diameter.
Current IPEM guidance suggests that image quality measurements should also be undertaken in body sized phantoms where these are available. Some scanner manufacturers provide body sized water phantoms for calibration purposes and whilst these allow for evaluation of water CT number and image noise they do not allow for spatial resolution or other CT numbers to be evaluated.
Some commercial phantoms have optional annuli which can be used to increase the overall size of the phantom to around 30-40cm diameter, however, all of the test details remain within the central 15cm diameter zone so again do not allow for evaluation of image quality metrics further away from the isocentre.
The Accumetra CTLX1 image quality phantom has been designed to specifically test compliance of lung screening scanners/protocols against the RSNA/QIBA small lung nodule profile. Details within the phantom allow for the evaluation of x and z axis spatial resolution, image noise, edge enhancement, spatial warping and CT numbers for air, Teflon, Delrin and Acrylic. These details are located at 0, 100 and 200mm from the isocentre, thereby allowing all image quality parameters to be evaluated at isocentre and at diameters corresponding to 20 and 40cm, thereby extending to the edge of the typical CT couch and being representative of typical patient diameters. The automated Accumetra analysis tool also interpolates the 100 and 200mm data to provide additional data at 160mm from isocentre.
We scanned the CTLX1 phantom on typical lung screening protocols on 16 scanners from 5 manufacturers (Canon, FujiFilm, GE, Philips & Siemens). On each scanner images were reconstructed with a range of reconstruction kernels and all image quality metrics were assessed at each position from the isocentre.
Results will be presented for all 5 manufacturers and will show that for some scanners there are significant changes in both x-axis and z-axis spatial resolution beyond 10cm from the isocentre whilst in other scanners image noise increases significantly towards the edge of the couch.
These changes, specifically the changes in spatial resolution may have a negative effect on the measurement of small objects, such as lung nodules, located in the periphery of the patient towards the edge of the couch and are therefore of particular importance when considering scanner procurement.10:50 Implementation of the detectability index as an image quality metric for CT optimisation - Mollie McFarlane, Debbie Harries - Royal Infirmary of Edinburgh
The detectability index is a single figure of merit which considers image resolution, noise texture, the clinical task and the human eye response to varying frequencies. The detectability index has been shown to have superior correlation with human observers when compared to the contrast-to-noise ratio and is more sensitive to a wider variety of image quality descriptors.
The detectability index was investigated as an optimisation tool for the adult head protocol on a scanner which was delivering unacceptably high doses to patients (above the national DRL). To reduce patient dose, the mAs was reduced until the DLP was approximately equal to the national DRL. By scanning the Catphan using the current protocol and the protocol with reduced dose, we confirmed that there was no significant reduction in detectability index and therefore were able to ascertain that reducing patient dose should have no noticeable impact on image quality. We also investigated the ability of the detectability index to optimise image quality to compensate for any loss due to dose reduction. To do this, we used all available reconstruction kernels and strengths to determine the highest possible detectability. To verify that human observers agreed that these new parameters provided superior image quality, a visual grading analysis was performed, with observers preferring the detectability-optimised image up to 88% of the time.
More recently, we investigated the utility of the detectability index within the procurement process. By measuring the detectability indices of images acquired using the head protocols of three manufacturers, we were able to compare the performance of scanners to aid in the decision-making process. It is hoped that by demonstrating the utility of this new metric, it can be incorporated into routine image quality measurement within NHS Lothian.11:10 Alternate Image Quality Metrics for Advanced Reconstruction Algorithms - Laurence King - Royal United Hospital Bath
Session 3 - Optimisation
12:00 Optimisation and Standardisation of CT Imaging Post Microwave Liver Ablation - Ed McDonagh, Louise Giansante, Jodie Basso, Joshua Shur, Nicos Fotiadis, Edward W Johnston - Royal Marsden NHS Foundation Trust
Thermal ablation has become an accepted treatment strategy for primary and oligometastatic secondary liver cancer, with level 1 evidence for both hepatocellular carcinoma [1] and colorectal liver metastases [2]. Image guided microwave liver ablation involves placement of needles from the skin directly into a target liver tumour to deposit lethal microwave energy. To be effective, the tumour must be fully heated along with a margin of normal tissue surrounding the tumour, known as the safety margin. Microwave ablation (MWA) is associated with lower cost, shorter hospital stays, lower morbidity and mortality than surgery [3] and can also be used following resection. However, because of high local recurrence rates [4], it is often used for inoperable tumours. To assess the treatment region (called an ablation zone) for treatment efficacy, a contrast enhanced CT scan is performed at the end of the procedure. However, even though CT scans have been performed clinically for tumour detection since the early 1970s, thermal injury in microwave ablation is a special and new circumstance for which scanning protocols have not yet been optimised or standardised.
We present a methodology we used to develop a CT protocol for optimal assessment of microwave ablation zones for assessment of ablation success. We studied the dynamic contrast enhancement characteristics of ablation zones using image segmentation and computational tools to identify optimal timing after contrast injection for maximum contrast between the central and peripheral components of ablation zones. Our optimised protocol was then applied in all subsequent patients undergoing MWA, and their scans were later compared to images from before optimisation using an image quality scale. Each ablation zone was visually scored by a consultant radiologist using a subjective five-point Likert score.
We will also discuss how our new protocol can assist radiologists in judging the efficacy of ablation procedures, enabling decisions to be made on table regarding repeat ablation (whilst still under anaesthesia) to increase the quality of ablations, reduce local recurrence and ultimately improve survival.
References:
[1] Xu, Xiao-Lin, et al. “Radiofrequency ablation versus hepatic resection for small hepatocellular carcinoma: systematic review of randomized controlled trials with meta-analysis and trial sequential analysis.” Radiology 287.2 (2018): 461-472.
[2] Ruers, Theo, et al. “Local treatment of unresectable colorectal liver metastases: results of a randomized phase II trial.” JNCI: Journal of the National Cancer Institute 109.9 (2017): djx015.
[3] Gurusamy, Kurinchi, et al. “Liver resection surgery versus thermal ablation for colorectal LiVer MetAstases (LAVA): study protocol for a randomised controlled trial.” Trials 19.1 (2018): 1-13.
[4] Kron, Philipp, et al. “Ablation or resection for colorectal liver metastases? A systematic review of the literature.” Frontiers in Oncology 9 (2019): 105212:20 Head CT Centering - Heloise Carpenter- Barking Havering and Redbridge University Hospitals NHS Trust
Patient misalignment in CT examinations has negative effects on image quality and patient dose and there are numerous studies which researches the impact of this in different CT examinations. During a CT examination, a scout scan is performed to determine patient alignment and is used by the CT scanner to optimise tube current modulation (TCM). If a patient is misaligned anteriorly from the centre, they appear magnified leading to a higher than optimal dose and if they are misaligned posteriorly a patient appears smaller leading to a lower than optimal dose due to the incorrect tube current being used in the examination from the TCM. Misalignment from isocentre also affects the bow tie filters which are used to reduce patient dose through considering the difference in patient attenuation at different points in the body. Bowtie filters vary the filtration of the x-ray beam assuming that the thickest region of the patient is located at the gantry centre. If a patient is positioned incorrectly the anatomy of the patient located at the isocentre will receive maximum dose whilst the anatomy of the patient in the periphery will receive a reduced dose. In this study an analysis tree in IQ works was developed and has studied 162 central slices of CT head examinations from three different scanners in Barking, Havering and Redbridge University Hospitals NHS Trust (BHRUT) finding that 86% of head CT examinations were aligned within 1cm of the isocentre.
12:40 Low dose PET-CT attenuation correction – How low can you go? - Dr Ruth Bradley, Dr Matthew Walker and Rachael Clitheroe - Oxford University Hospitals NHS Foundation Trust
An ultra-low dose PET-CT attenuation correction protocol was developed to meet the needs of a new clinical trial. The trial is using a novel radiopharmaceutical with a long half-life tracer. It is then possible participants may have several PET-CT imaging events over a short period of time.
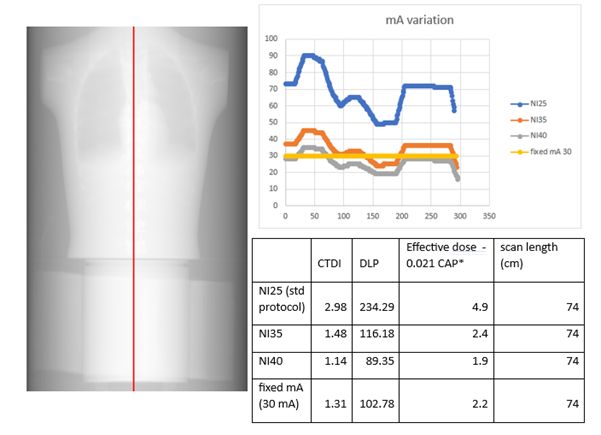
In conjunction with the Radioisotopes physics team, the clinical team and advice from the manufacturer, different parameters were explored using phantom scans on the scanner. A chest phantom, CATPHAN and PET-CT phantom were scanned and processed using standard reconstruction parameters. mA values were extracted using SPICE-CT software developed by John Loveland. Initial results are shown below and a further visit was performed to test lower factors and to use additional water bags around the PET-CT phantom to simulate a larger patient.
The PET-CT reconstruction was performed successfully for all scans with SUV within tolerance. The final proposed protocol has an estimated dose of 0.6mSv. Analysis results will be presented for the different phantoms scanned and clinical implications discussed.Session 4 - Protocols and Software
14:30 Developing a CT scan protocol comparison tool - Dr Jamie Dormand, Ed McDonagh - Royal Marsden NHS Foundation Trust
CT scans are typically standardised by clinical task using scan protocols that define scanning steps, exposure parameters, image reconstruction options and clinical processes such as contrast administration. Any required protocol changes must be correctly applied to ensure image quality and patient doses are not adversely affected. A system of checking protocols before and after changes are made can help to reduce mistakes.
CT scan protocols are often extremely complex, containing hundreds of parameters, so determining if specific changes to protocols are important can be time consuming. Following software upgrades it may appear that a large number of changes have occurred, obscuring important differences. This can contribute to an environment where protocols are not checked frequently enough or important changes are missed. Some manufacturers offer software to track protocol changes, but this usually requires the purchase of an additional license.
We present a Siemens CT protocol comparison tool developed in-house with the Python programming language. Complete folder structures of all protocols exported from a scanner can be compared to previously exported structures, allowing regular monitoring to be quickly implemented. A list of parameters deemed to be important are compared between each protocol, any changes are presented to the user and a comparison summary can be appended to an excel sheet as a record. Protocols that are renamed or moved to different folders within the structure can also be tracked.
The tool will be demonstrated in real-time against previously used methods to highlight the advantages it affords. Examples of clinical application will be presented alongside current limitations and planned future developments will be discussed.14:50 Experience with New Siemens CT Software - Wayne Hartley - Newcastle upon Tyne Hospitals
The new Siemens software is significantly different from the software we’re used to and is not always regarded as intuitive. This short talk will cover some of the difficulties we have encountered when testing scanners with the new software including where ‘cancel move’ is hidden, how to access sequential scanning when it’s not an option on any of the protocols and overcoming the default 2 slice minimum for sequential abdomen. Following the talk I will invite others to share their experiences. This should help commissioning and QA testing run more smoothly for all.
15:10 CT Dosimetry Calculators: new UKHSA and ImPACT – update of progress, overview of differences - Sue Edyvean, Jan Jansen, John Holroyd - UKHSA
It is about 10 years since we separately presented at CTUG; on the method to input your own scanner into the ImPACT calculator and a development version of a new calculator from the now named UKHSA. This work in progress is to give an overview of various aspects of work and developments that have happened on the UKHSA calculator, and to outline the fundamental differences between that and the one from ImPACT, and especially those that contribute to different organ and effective doses from the same input information. A new web page has been created to enable available information to be accessed easily (with the new calculator currently described as a work in progress); Medical Dosimetry Group - Dosimetry for Patients (ukhsa-protectionservices.org.uk). UKHSA are also contributing to the work on an ICRP web-based calculator, and this will also be mentioned as a taster as to what to expect in a few years’ time.
The ImPACT calculator was based on the NRPB organ dose co-efficients generated from Monte Carlo calculations using a range of scanner models from the 1990s. The calculations for each scanner model/tube voltage/beam shaping filter combination were undertaken on a version of the MIRD Cristy stylised phantom, delineating ICRP organs identified for ICRP 60. The calculator adapted a method to calculate for organs of interest relevant for ICRP 103. The method of scanner matching was based on CTDI data in air and in phantom (utilising the centre and periphery measurements separately) to enable matching of a newer scanner model (and an associated kV, beam shaping filter) to a NRPB scanner dataset, in terms of nearest effective dose. Matches were according to head and body examinations.
The new UKHSA calculator is based on organ dose co-efficients generated from Monte Carlo calculations; for more contemporary scanner models, for ICRP voxel phantoms (ICRP 110) which contain organs relevant to ICRP 103, and utilising UKHSA bone marrow correction factors. The matching process for a new scanner has similarities to the ImPACT approach, but all CTDI data is incorporated to give one match for each scanner/kV/beam shaping filter/ICRP phantom combination which applies for all examination regions. Earlier this year saw the culmination of the research underpinning this twelve-year project, with the final paper, of a series of four, being published in Physics Medicine and Biology1-4. With this work published, the development of the calculator now continues towards its final stages. The Alpha version is undergoing internal testing, including the helpful input from an IPEM trainee, with the Beta version soon to be released to a wider group. A demonstration will be given, and a request issued for interested testers and reviewers to enable this calculator to be finalised in as ‘user friendly’ form as possible, and subsequently be released.
Paper references
[1] Jan T M Jansen and Paul C Shrimpton. Development of Monte Carlo simulations to provide scanner-specific organ dose coefficients for contemporary CT. PMB 2016 Jul 21;61(14):5356-77. doi: 10.1088/0031-9155/61/14/5356.
[2] Jan TM Jansen, Paul C Shrimpton, John Holroyd and Sue Edyvean. Selection of bone dosimetry models for application in Monte Carlo simulations to provide CT scanner-specific organ dose coefficients. PMB 2018 Jun 19;63(12):25015 (22pp) doi: 10.1088/1361-6560/aac717.
[3] Jan TM Jansen, Paul C Shrimpton and Sue Edyvean. CT scanner-specific organ dose coefficients generated by Monte Carlo calculation for the ICRP adult male and female reference computational phantoms. PMB, 2022 Nov 16;67(22):225015. doi: 10.1088/1361-6560/ac9e3d
[4] Jan TM Jansen, Paul C Shrimpton, and Sue Edyvean. Development of a generalized method to allow the estimation of doses to the ICRP reference adults from CT, on the basis of normalized organ and CTDI dose data determined by Monte Carlo calculation for a range of contemporary scanners. PMB, 68 (2023) 035022. doi: 10.1088/1361-6560/acb2a8.15:55 UKHSA Dosimetry calculator and practical demonstration - Jan Jansen - UKHSA
Discussion and updates
16:10 IPEM 32 Part 3 Update - Susan Doshi
16:20 Roundtable discussion